EMS Statistics
Current Emergency Medical Services Statistics in Taipei 2017 (Updated on?Oct. 24, 2017). -940 79,639 -10,331 -2,381 -658 -414 -244 -2,080 Statistics on EMS Treatments from?2007 to 2016, released by the Taipei City Fire DepartmentNumber of EMS Dispatches Number of People Hospitalized Current Month 7,708 5,843 Prior Month 7,699 5,841 Comparison 9 2 The Same Month Last Year 8,648 6,144 Comparison -301 Current Year 105,358 Prior Year 115,689 82,020 Comparison 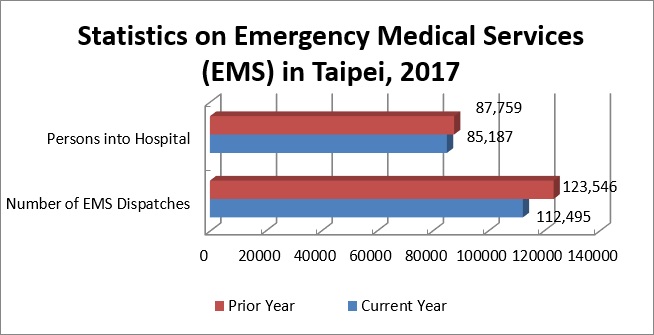
Number of people Hospitalized non-trauma trauma Current Month 7,716 4,324 3,392 Prior Month 8,374 4,738 3,636 Comparison The Same Month Last Year 8,155 4,626 3,529 Comparison with Same Period last Year -439 -302 -137 Current Total this Year 73,796 42,497 31,299 Previous Year 75,876 44,197 31,679 Comparison with Previous Year -1,700 -380 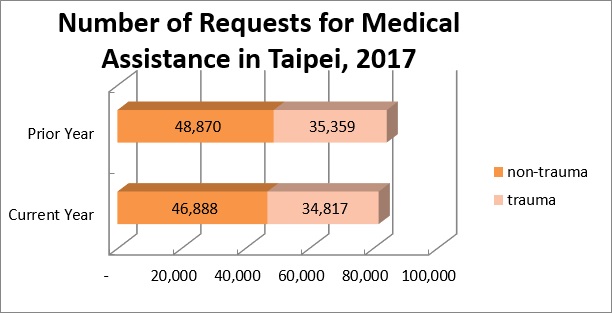
Year 2007 2008 2009 2010 2011 2012 2013 Number of EMS Dispatches 96,545 101,855 112,599 125,204 137,310 135,920 132,573 Year 2014 2015 2016 Number of EMS Dispatches 138,452 140,160 141,470 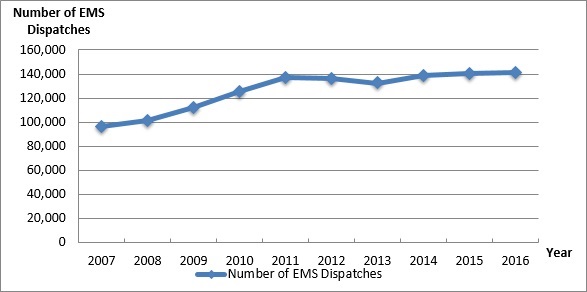
Year 2007 2008 2009 2010 2011 2012 2013 EMS Treatments 3.299 3.122 3.214 3.191 3.107 3.081 2.974 Year 2014 2015 2016 EMS Treatments 2.638 2.372 2.307 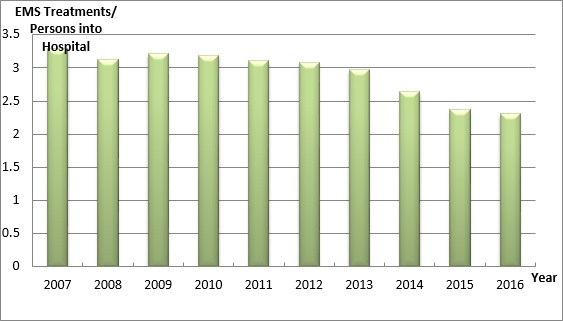
![Taiwan.gov.tw [ open a new window]](/images/egov.png)